Data tables are used to see how changing one or two variable data in a formula affects the result in a Microsoft Excel Worksheet. It creates a range of cells in a table form that shows the results when the variable data is applied in the calculation. Data table allows you to easily calculate multiple results in a single operation and compare the results of all the different variations of one or two data in a single worksheet. For example, data table can be used if you want to easily calculate loan repayment for varying interest rate and you can easily compare the repayment amount for all of the different interest rate specified.
Data tables in MS Excel is part of the What-if-analysis tool. A data table can only accomodate maximum two variable data, one for the column input and the other for the row input. If you want to compare and analyze more than two variables, you can use Scenarios in Excel. Read this to learn how you can create and work with Scenarios in Excel.
As I mentioned, data tables can only handle two variables. However, a data table can handle as many different values as you want for these two variables. There are two types of data tables, 1) One-variable data table 2) Two-variable data table.
One-variable Data Table: You can use one-variable data table to see how different values in a single cell in one or more formulas affect the results of those formulas. For example, you can use one-variable data table if you want to see how much you have to repay for a loan if the interest rate is 2%, 3%. 4%, etc. for a given period of time (note: only the interest rate is changing in this case).
Two-variable Data Table: You can use two-variable data table to see how different values in two cells in a formula will affect the result of that formula. For example, to see the monthly repayment for a loan if the interest rate (2%, 3%. 4%, etc.) and the loan terms ( 5, 10, 15 years, etc.) are changing (note: in this case, both interest rate and the loan terms are changing).
How to Create a One-Variable Data Table
You can create a one-variable data table in a worksheet either for a row input variable or for a column input variable. For the purpose of this tutorial, I use a Morgage Analysis worksheet which can be downloaded from here.
Step 1:

Type out the values and formulas to calculate the repayment/month for the loan payment as shown in the example given. Leave enough empty columns for you to create the data table. You can use Financial function PMT to calculate the monthly repayment amount (Formulas tab | Function Library group | Financial | PMT) – [=PMT(C6/12,C7,-C5)]
Once the formula for the worksheet is done correctly, you can create a data table to see how changes in interest rate will affect the monthly repayment. To do that;
Step 2:
Type out the range of interest rates that you want to calculate the repayment amount for.

Step 3:
Select the range of cells, including the calculated field showing the monthly repayment amount. In this example, cell range from B10 to C23.

Step 4:
Click on Data tab | Data Tools group | What-If Analysis | Data Table
Step 5:
Since the changing cell (input cell, here the Interest Rate, cell $C$6) is in column, enter $C$6 in “Column input cell” field and click OK.
This will create a one-variable data table showing the monthly repayment amount for different interest rate, varying from 2.00% to 5.00%.

How to Create a Two-Variable Data Table
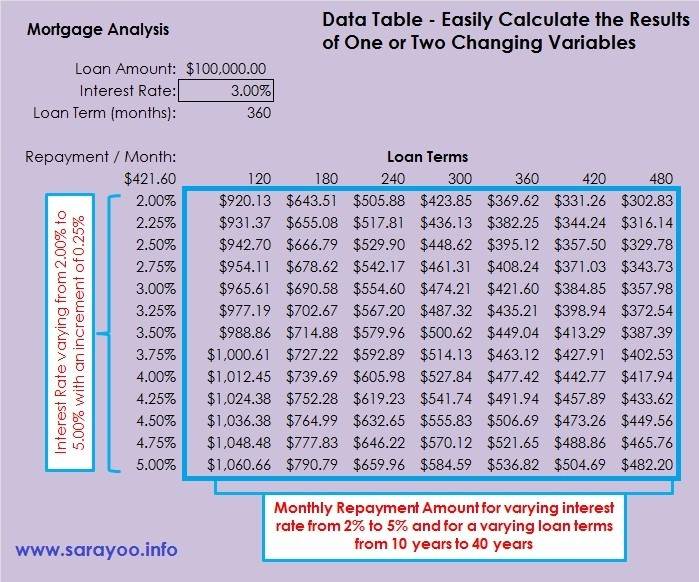
You can create a two-variable data table in a worksheet with a row input variable and a column input variable. For the purpose of this tutorial, I use the same Morgage Analysis worksheet used in the one-variable data table demo. In this case, we will have two variables, one is the varying interest rate (from 2% to 5%) and the other is the loan term, varying from 10 years to 40 years with an increment of 5 years.
Step 1:
Type out the values and formulas to calculate the repayment/month for the loan payment as shown in the example given. Leave enough empty columns for you to create the data table. You can use Financial function PMT to calculate the monthly repayment amount (Formulas tab | Function Library group | Financial | PMT) – [=PMT(C6/12,C7,-C5)]
Step 2:
Type out the range of interest rates and the loan terms that you want to calculate the repayment amount for.

Step 3:
Select the range of cells, including the calculated field showing the monthly repayment amount. In this example, cell range from B10 to I23.
Step 4:
Click on Data tab | Data Tools group | What-If Analysis | Data Table
Step 5:
Since there are two changing cells (one in the row and the other in the column), you need to enter both the variables. In the “Row input cell” field, enter $C$7 and the “Column input cell” field, enter $C$6. Then click OK.

This will create a two-variable data table showing the monthly repayment amount for different interest rate (varying from 2.00% to 5.00%) and for different loan terms (varying from 10 years to 40 years).
You cannot delete only one value in a data table, if you want to delete, you have to delete the entire data table. In the given case, you have to delete values in cell range from C11 to I23.

Watch this video to see how a Data Table is created: